Barefoot Resort Homes Market Report

or Create your own market report

Recently Sold Homes in Barefoot Resort
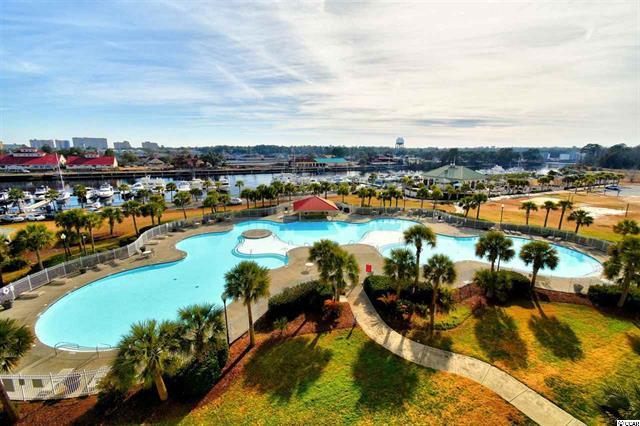
 

View the most up-to-date data from the Coastal Carolina Multiple Listing Service below for Homes in Barefoot Resort.  You can view a snapshot of the most recent homes available for sale, under contract homes and at the bottom of the page you can see the most current homes sold by address.  

If you’re thinking of putting your Barefoot Resort home on the market, don’t wait. A seller will always negotiate the best deal when demand is high and supply is low.  Use the home estimate tool at the bottom of the page if you are curious about what your Barefoot Resort home could sell for in today's hot market.

If you'd like to receive a monthly market activity report for your neighborhood, use the tool above to sign up or click here:  Create Your Own Market Report

Address Beds Baths Living ft2 List Price Cost per ft2 DOM
2909 Winding River Rd. 4 4 3,607 $724,900 $200 10 days
2208 Bentbill Circle 5 5 3,727 $2,195,000 $588 40 days
5411 Pheasant Dr. 4 4 3,887 $959,900 $246 48 days
5004 Wax Myrtle Ct. 3 3 2,354 $599,900 $254 62 days
3502 Club Course Dr. 4 3 2,818 $599,900 $212 64 days
5304 Pheasant Dr. 5 4 3,715 $879,900 $236 75 days
6011 Mossy Oaks Dr. 3 2 1,518 $535,000 $352 77 days
3310 Thick Branch Rd. 3 2 1,738 $455,000 $261 81 days
5407 Pheasant Dr. 5 5 3,127 $799,000 $255 102 days
2117 Via Palma Dr. 4 3 2,710 $799,000 $294 120 days
5010 Weatherwood Dr. 3 2 1,448 $364,900 $252 172 days
4311 Grovecrest Circle 4 4 2,828 $728,000 $257 190 days
Average: 3.9 3.4 2,789 $803,366 $284 87 days
Viewing 1 - 12 of 12
Address Beds Baths Living ft2 List Price Sold Price Cost per ft2 DOM Sold Date
2318 Via Palma Dr. 4 3 2,710 $725,000 $690,000 $254 55 days 10/26/26
5911 Bridlewood Rd. 3 2 1,966 $468,000 $475,000 $241 40 days 10/20/26
5656 Club Course Dr. 3 2 1,804 $440,000 $440,000 $243 56 days 10/8/26
5801 Swift St. 3 2 1,300 $379,000 $375,000 $288 113 days 10/6/26
5401 Pheasant Dr. 4 4 3,319 $875,000 $855,000 $257 115 days 10/6/26
4602 Marsh Creek Dr. 4 4 2,901 $975,000 $950,000 $327 20 days 9/29/26
2212 Via Palma Dr. 4 3 2,567 $774,900 $730,000 $284 155 days 9/29/26
5507 Pheasant Dr. 4 4 3,218 $975,000 $975,000 $302 42 days 9/24/26
5709 Whistling Duck Dr. 3 2 1,774 $499,900 $480,000 $270 50 days 9/24/26
5403 Via Verde Dr. 3 4 2,610 $849,900 $825,000 $316 150 days 9/24/26
3018 Winding River Rd. 4 3 3,151 $579,900 $540,000 $171 178 days 9/21/26
5101 Weatherwood Dr. 4 2 1,702 $445,900 $432,500 $254 132 days 9/16/26
2200 Via Palma Dr. 4 4 3,958 $1,449,500 $1,410,000 $356 114 days 9/9/26
6009 Mossy Oaks Dr. 3 2 1,920 $450,000 $437,500 $227 40 days 9/8/26
5800 Spotted Owl Landing 3 2 1,974 $469,900 $435,000 $220 78 days 9/1/26
Average: 3.6 3.0 2,567 $753,591 $721,930 $271 95 days
Viewing 1 - 15 of 36

Provided courtesy of The Coastal Carolinas Association of REALTORS®. Information Deemed Reliable but Not Guaranteed. Copyright 2026 of the Coastal Carolinas Association of REALTORS® MLS. All rights reserved. Information is provided exclusively for consumers’ personal, non-commercial use, that it may not be used for any purpose other than to identify prospective properties consumers may be interested in purchasing.

The Myrtle Beach Real Estate Market is Shifting! 

Find out how it has impacted your properties selling price.  Check your property value here.